Key Application Features
Discover in detail the powerful tools integrated into this solution to optimize your organization.
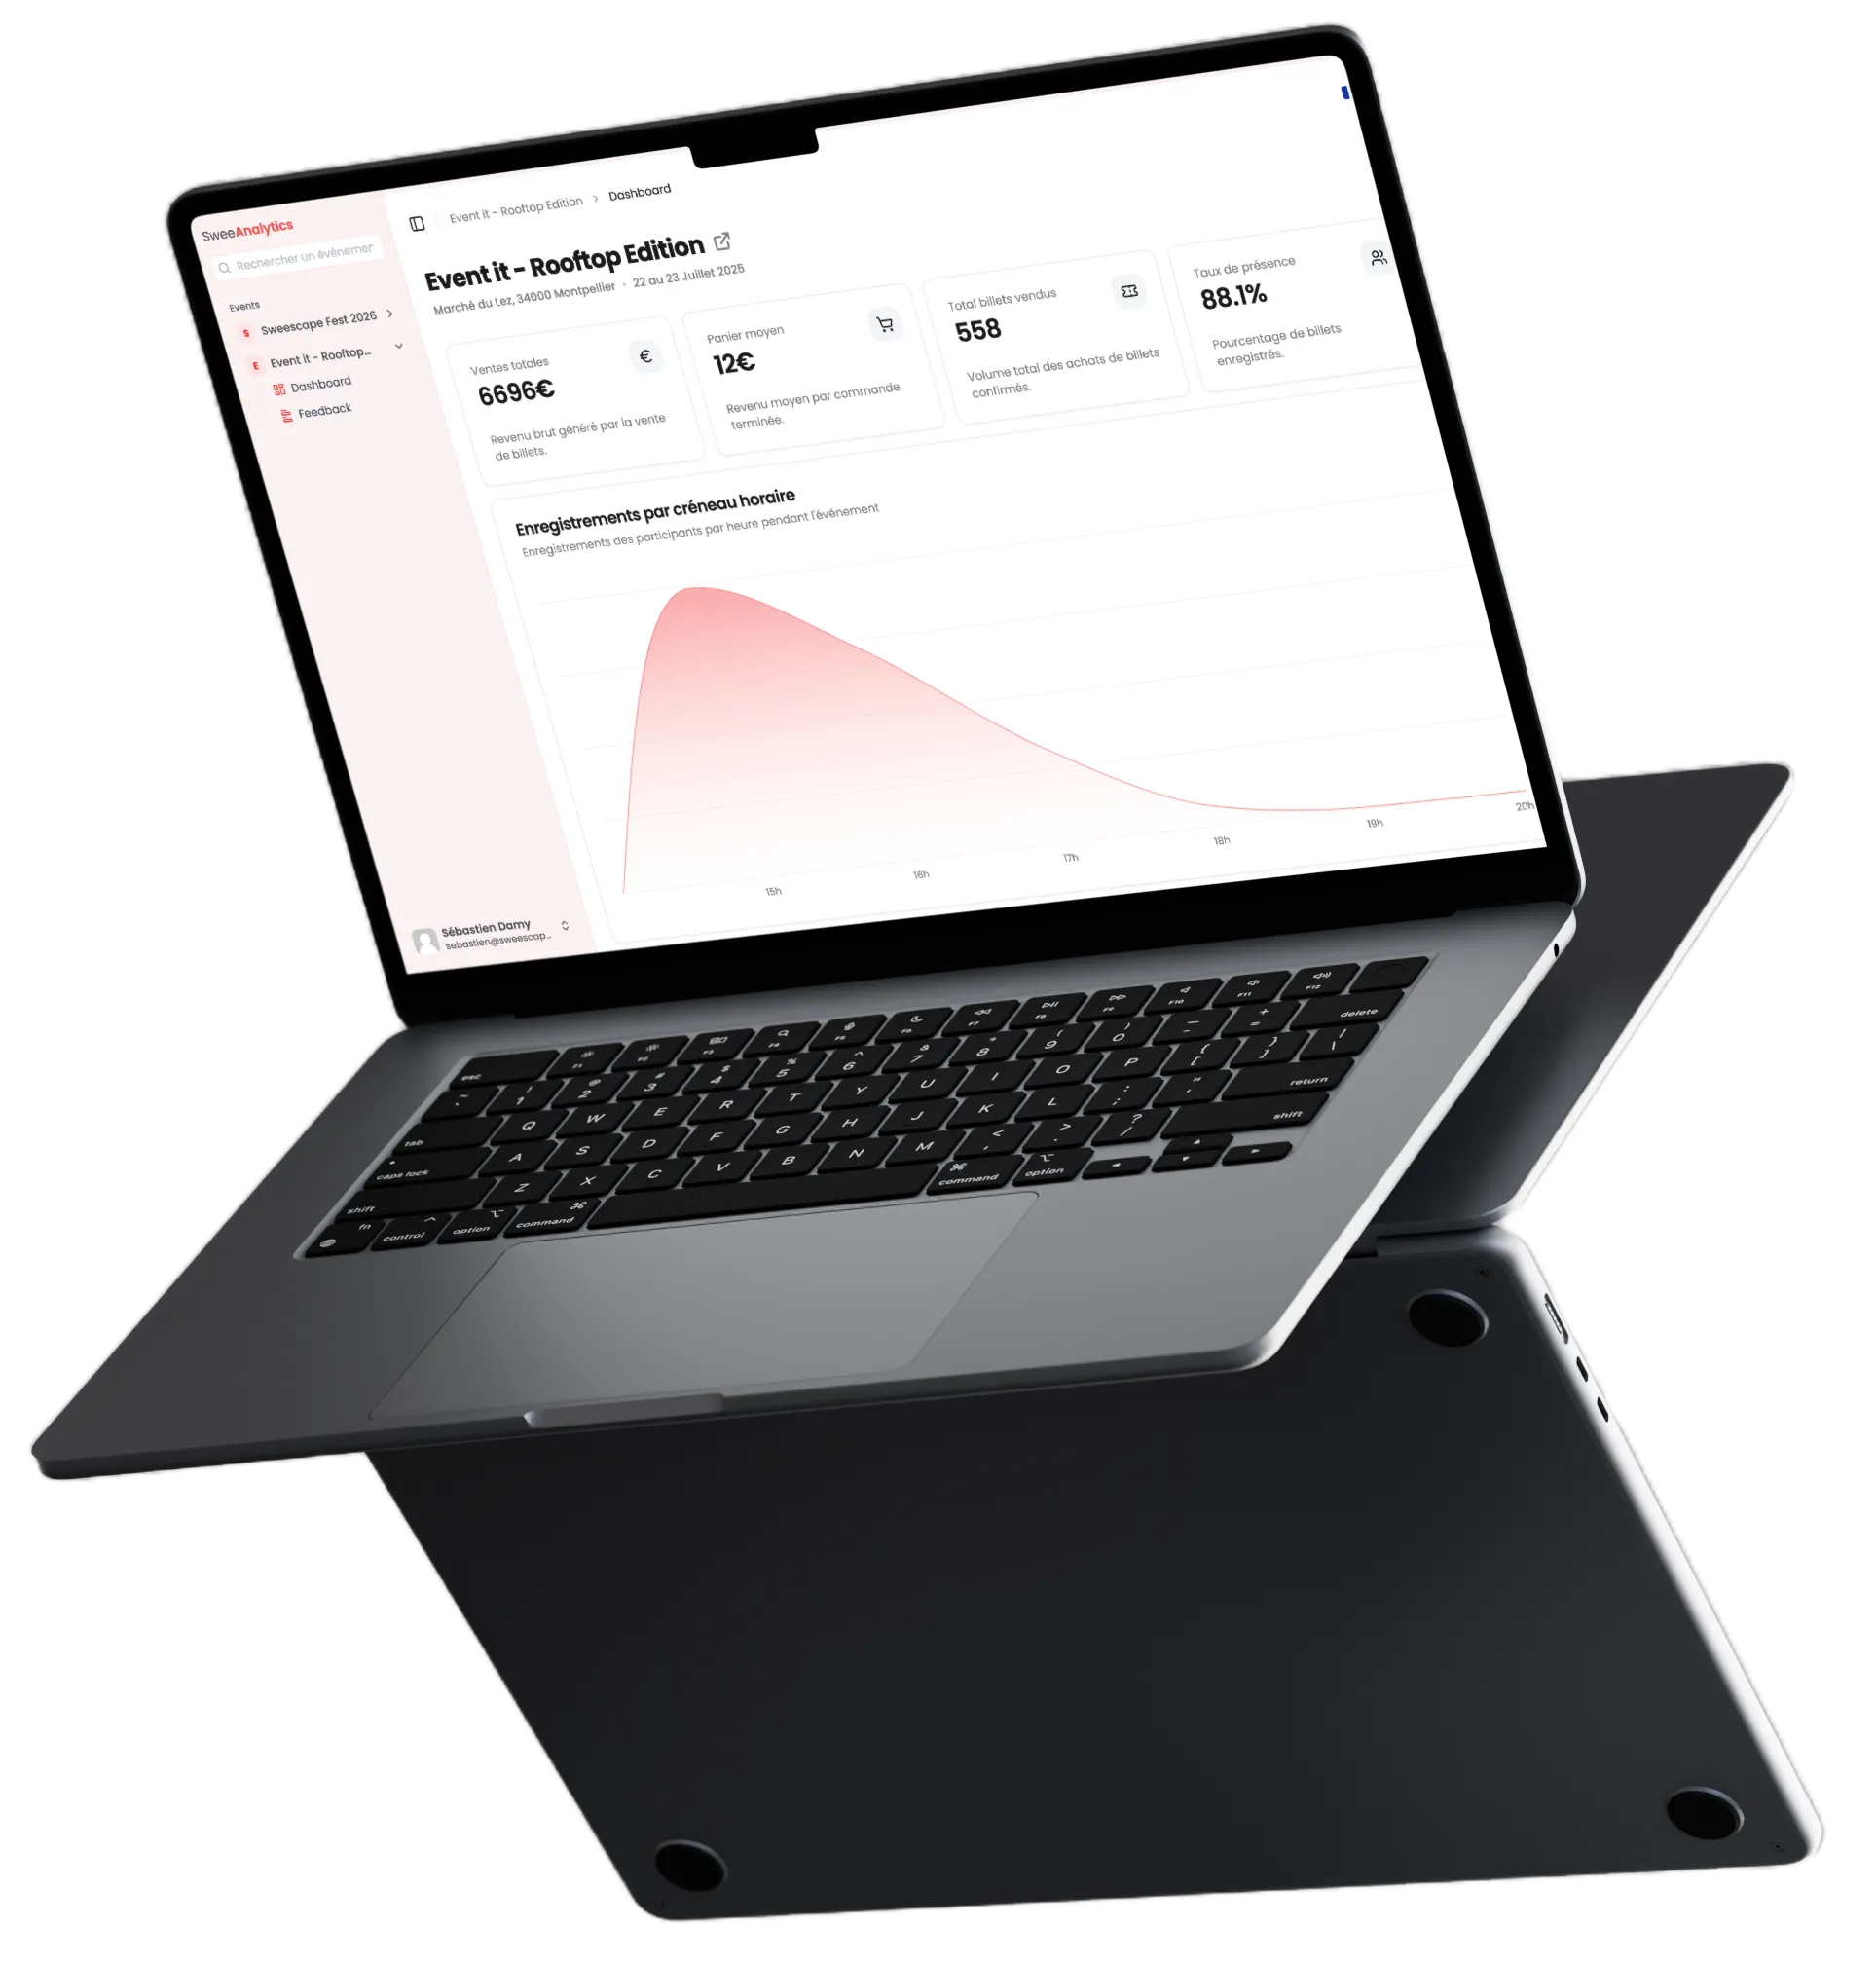
The key figures of your event, accessible at a glance
SweeAnalytics centralizes all your event's critical data in a single space. No need for multiple tools: everything is already there.
-
Total Sales
Gross revenue generated by ticket sales. Track your commercial performance in real-time and anticipate your goals.
-
Average Basket
Average revenue per completed order. Identify levers that encourage your attendees to spend more.
-
Total Tickets Sold
Total volume of confirmed purchases. Adjust your logistics and resources based on real demand.
-
Attendance Rate
Percentage of attendees effectively checked in. Measure real engagement versus registrations and detect drop-off points.
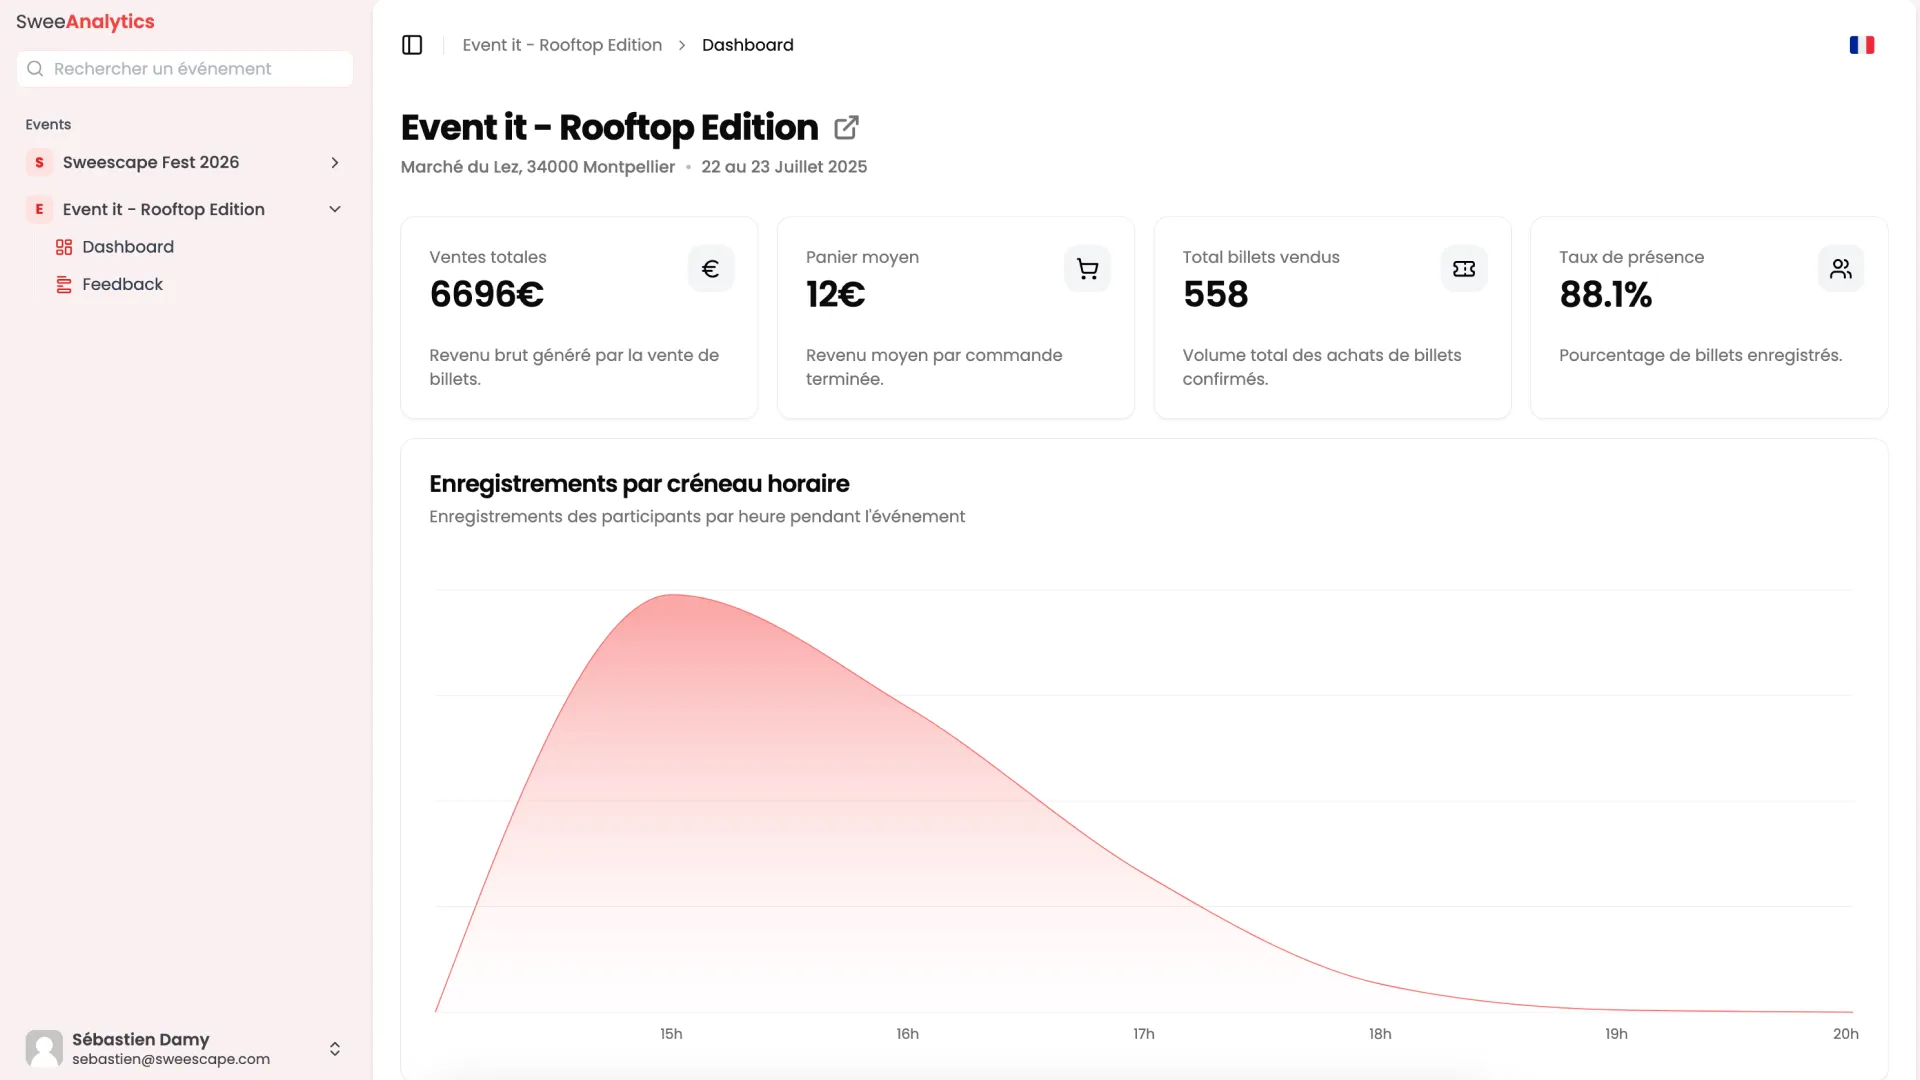
Visualize arrival peaks precisely throughout your event. Optimize the deployment of your teams and adjust your logistics accordingly.
Measure the real impact of every automation deployed
Reminder emails, welcome SMS, automated feedback forms: SweeAnalytics allows you to track the performance of every message sent. Open rates of your emails and SMS to evaluate the relevance of your subject lines and timing. Click-through rates on your links to measure the real interest shown in your content and calls to action. Completion rates of feedback forms to identify the engagement level of your attendees. You also access the global rating of collected reviews as well as your Net Promoter Score (NPS), two decisive indicators to know if your attendees are ready to recommend your event.
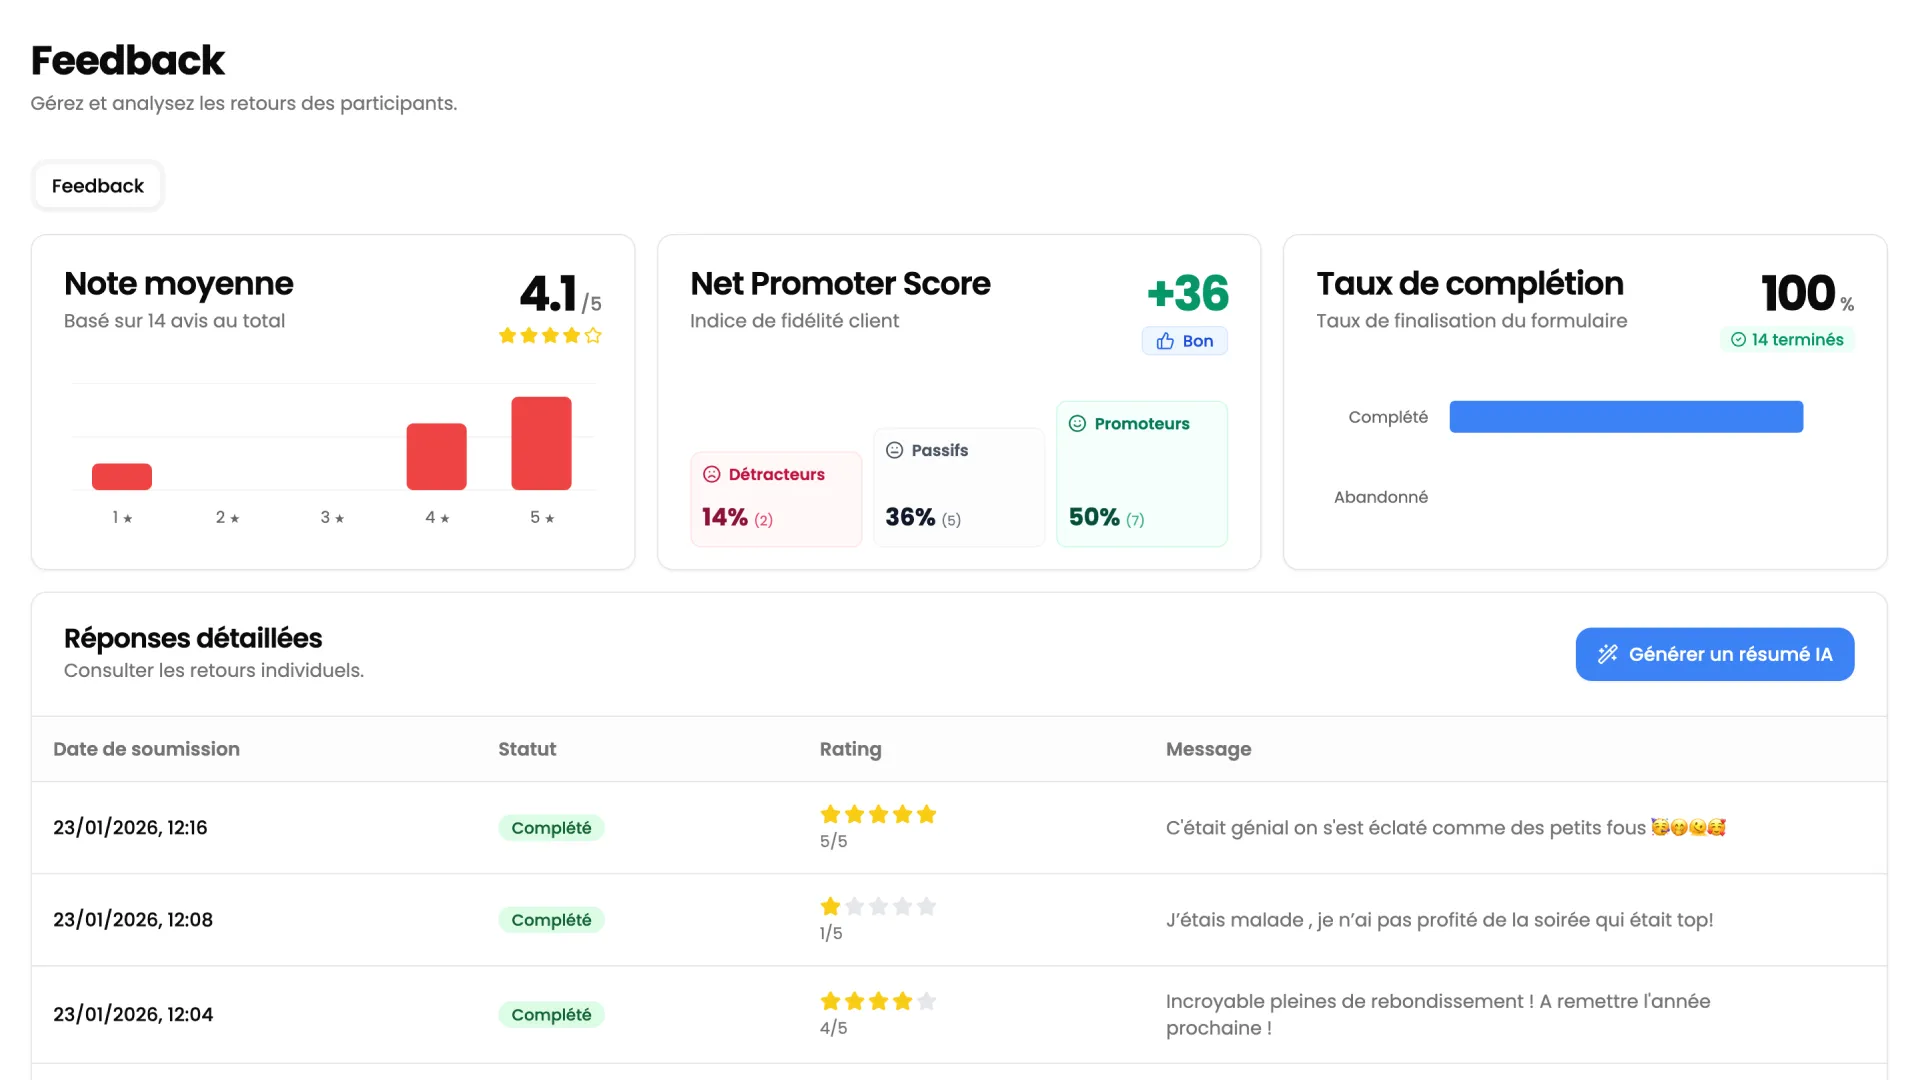
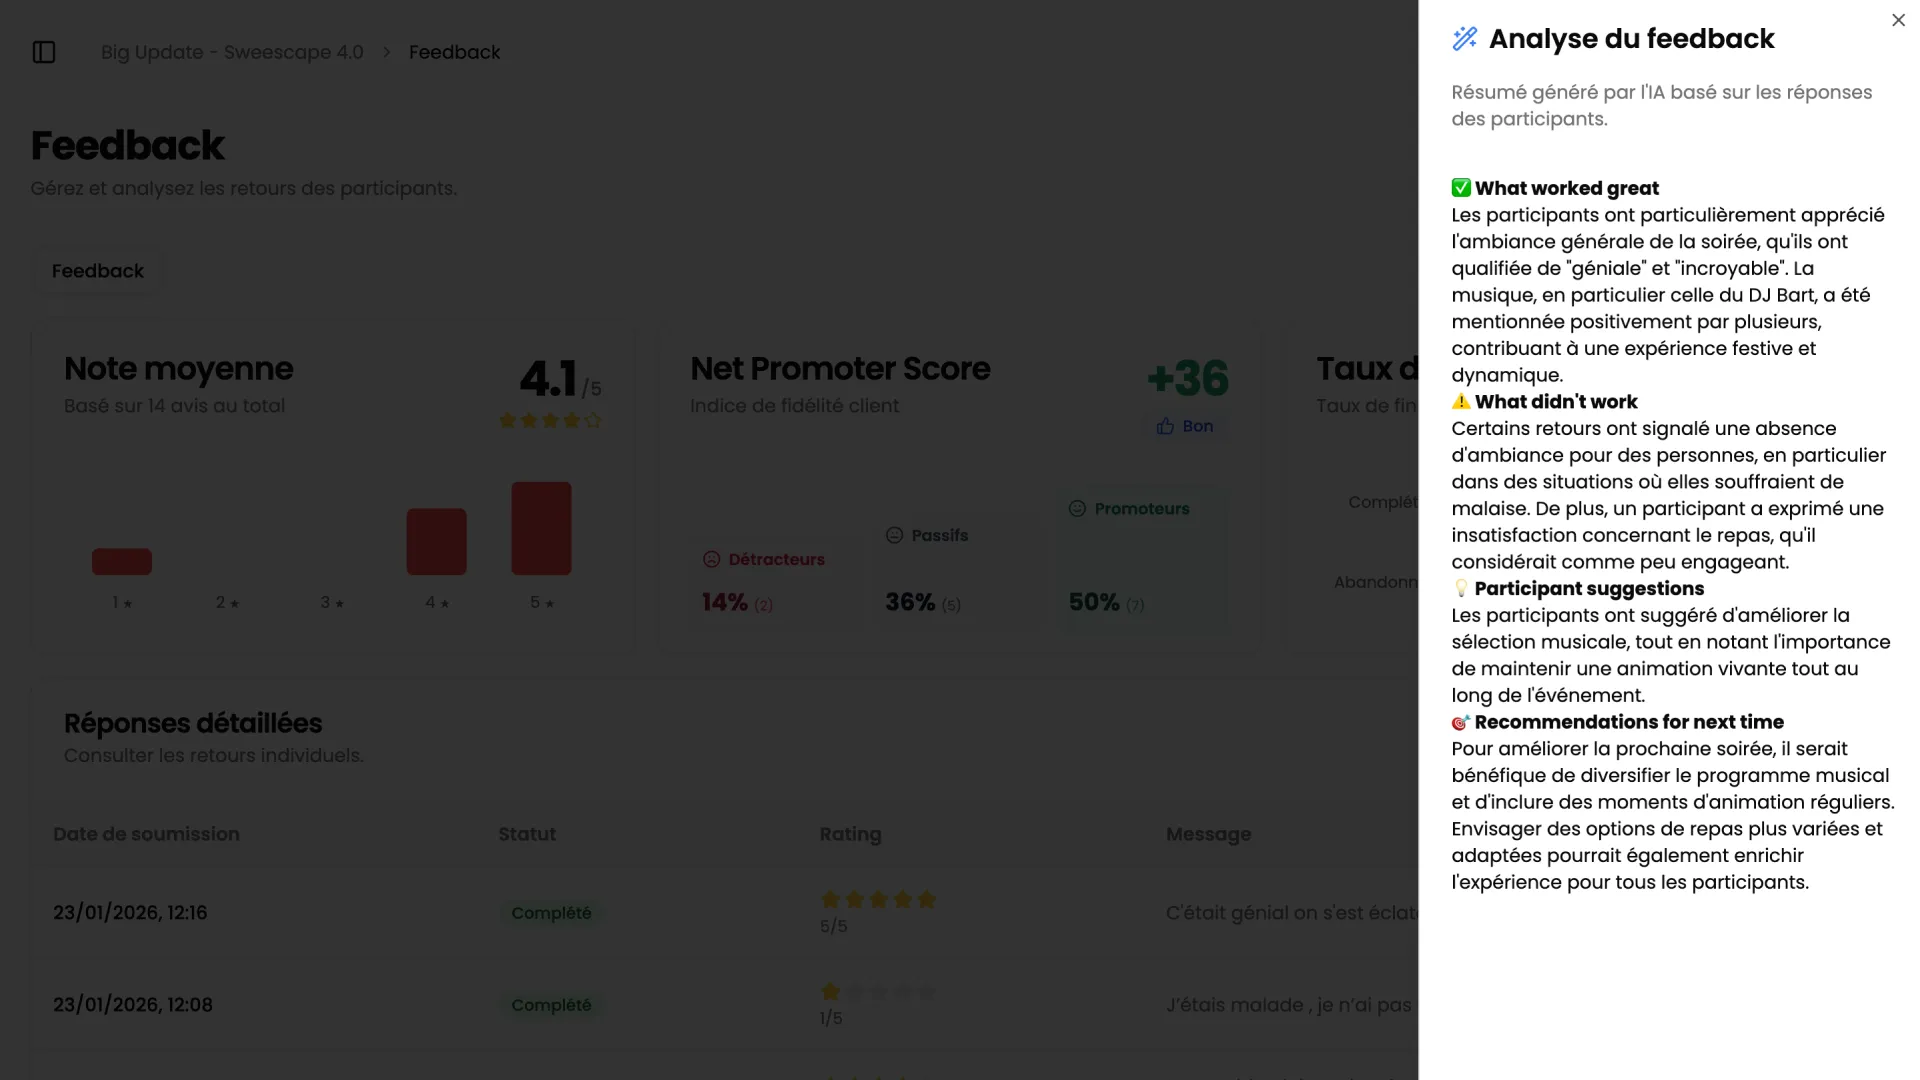
Transform hundreds of feedbacks into actionable insights in a few seconds
You have recovered dozens (or even hundreds) of attendee feedbacks after your event. The problem? Reading and analyzing each response manually would take hours. Our AI does it for you. As soon as feedbacks are collected via your automations, the AI integrated into SweeAnalytics analyzes all responses. It produces a synthetic summary that highlights the strong points of your event, priority areas for improvement, and concrete actions to take to optimize your next editions. You thus move from a large volume of raw data to a clear list of strategic decisions, in just a few seconds. You save precious time, reduce the risks of interpretation errors, and make your decisions based on real data rather than subjective impressions.
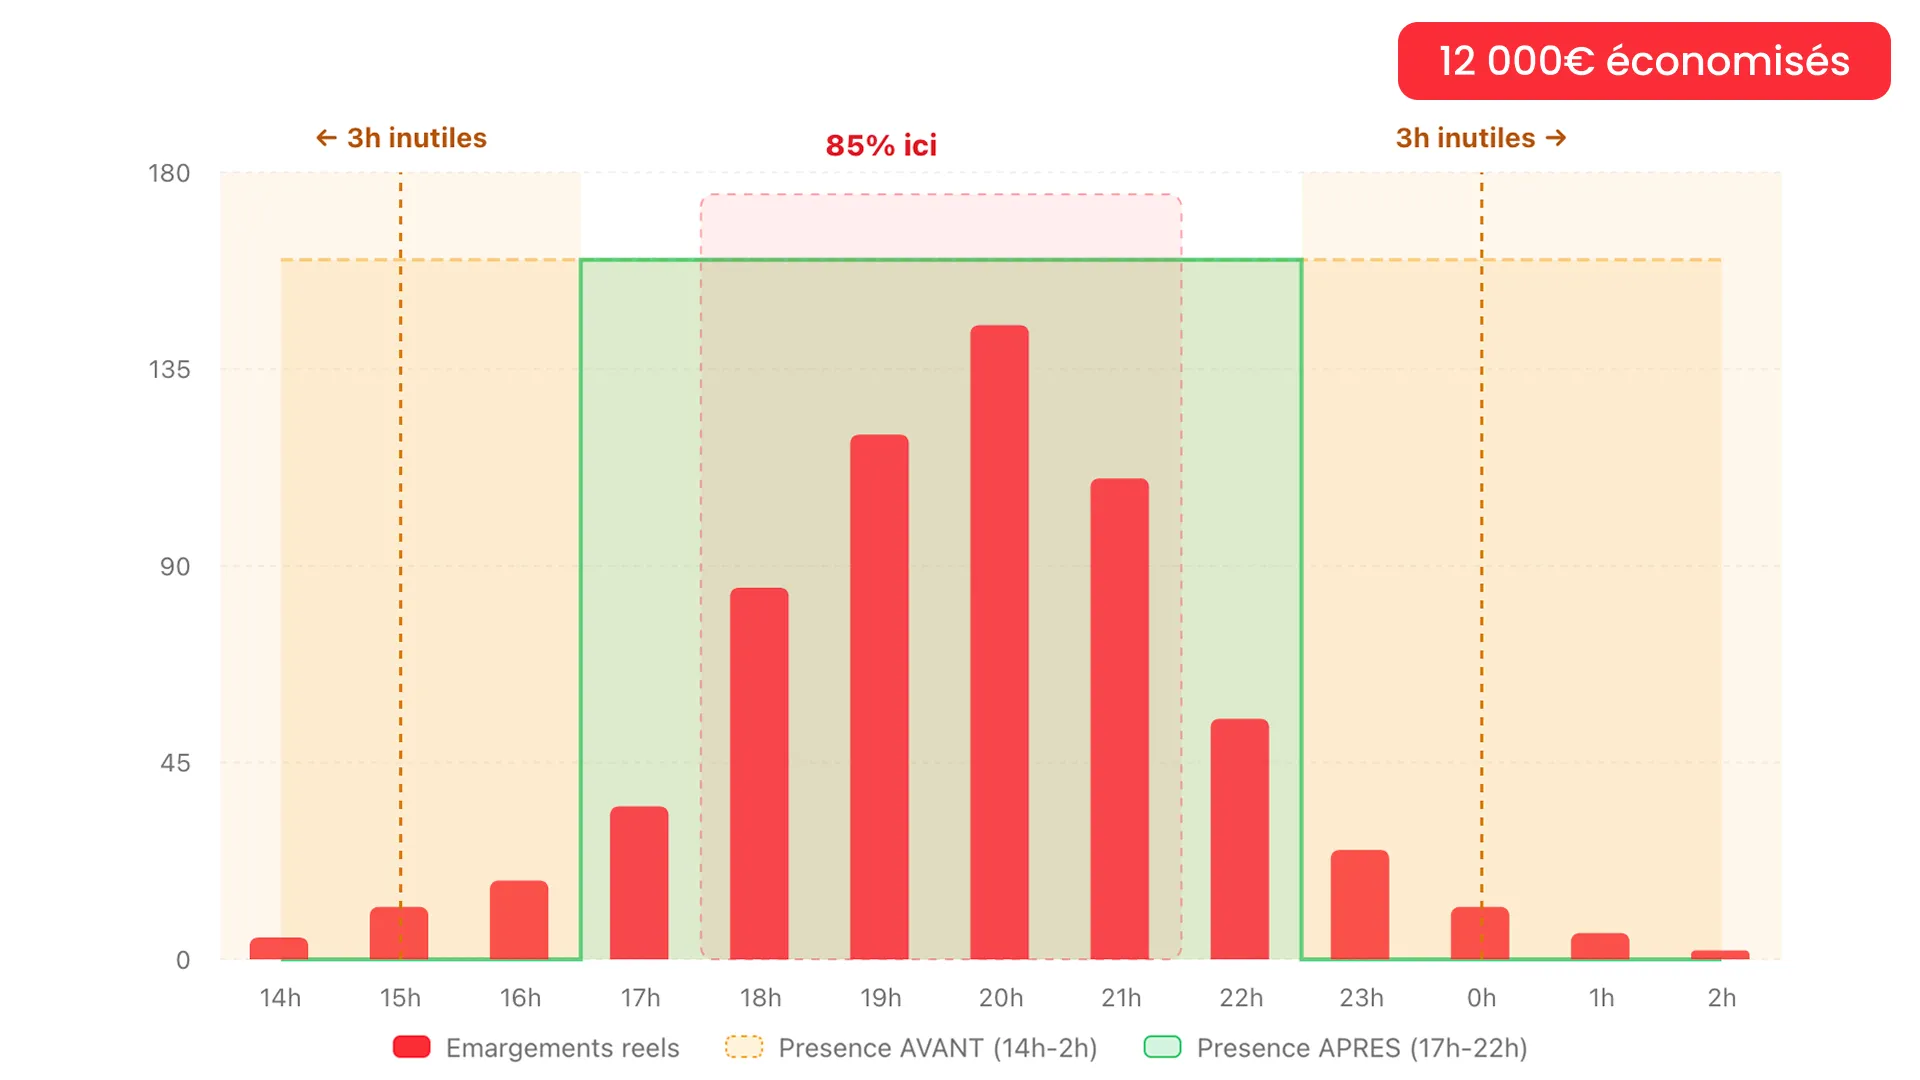
How a festival reduced its operational costs by €12,000 by optimizing its welcome hours
Music festival, 5,000 attendees. Hostesses were present from 2 PM to 2 AM, paid by the hour, even during dead slots. The SweeAnalytics check-in graph revealed that 85% of arrivals were concentrated between 6 PM and 9 PM. Decision: open at 5 PM instead of 2 PM, and keep teams until 10 PM to cover the peak. Result: €12,000 in savings, smoother welcome, staff in the right place at the right time.